This is a comprehensive test post created to verify that all editorial features, data visualizations, mathematical typography, interactive widgets, and integrations work seamlessly after porting the site to Hugo.
Feature Verification Checklist
- KaTeX Mathematical Typesetting (inline & display equations, matrices, Greek symbols)
- D3.js Data Visualizations (dynamic SVG generation, animations, tooltips)
- X / Twitter Embeds (Hugo shortcode & native blockquotes)
- Code Highlighting & Fences (Python, JavaScript, Shell, SQL with line numbering)
- Collapsible Details Blocks (
<details>&<summary>) - Footnotes (single, multi-paragraph, with code references)
- Markdown Tables (formatted with text & numeric alignments)
- Blockquotes & Citations
- Media & Images (cover image, inline responsive figures with captions)
- Static Asset Links (CSV / data file downloads)
- Taxonomies & Meta (tags, categories, date, reading time)
- Post Navigation & Disqus Comments
1. Mathematical Typesetting (KaTeX)
Mathematical equations are rendered client-side using KaTeX with math = true enabled in the front matter.
Inline Formulas
We can express the standard sigmoid activation function as $\sigma(z) = \frac{1}{1 + e^{-z}}$, the Gaussian density with mean $\mu$ and variance $\sigma^2$ as $\mathcal{N}(x \mid \mu, \sigma^2)$, and algorithmic time complexity such as $\mathcal{O}(N \log N)$.
Block Display Equations
The normal distribution integral (Euler-Poisson integral):
$$\int_{-\infty}^{\infty} e^{-x^2} \, dx = \sqrt{\pi}$$The Mean Squared Error (MSE) loss with $L_2$ regularization:
$$\mathcal{L}_{\text{total}}(\mathbf{w}) = \frac{1}{N} \sum_{i=1}^{N} \left( y_i - \mathbf{w}^T \mathbf{x}_i \right)^2 + \lambda \|\mathbf{w}\|_2^2$$Covariance Matrix formulation:
$$\mathbf{\Sigma} = \begin{pmatrix} \operatorname{Var}(X_1) & \operatorname{Cov}(X_1, X_2) \\ \operatorname{Cov}(X_2, X_1) & \operatorname{Var}(X_2) \end{pmatrix} = \begin{pmatrix} \sigma_1^2 & \rho \sigma_1 \sigma_2 \\ \rho \sigma_1 \sigma_2 & \sigma_2^2 \end{pmatrix}$$2. Interactive Plots & Visualizations (D3.js)
With d3 = true enabled, D3.js v7 is automatically injected into the page header, allowing direct SVG manipulation and reactive charts.
Here is a live, interactive bar chart rendered directly into the page:
📊 Daily Processing Throughput (Records / sec)
Hover over bars to inspect values.3. X / Twitter Embeds
Twitter embeds can be included either with the custom {{< tweet user="..." id="..." >}} shortcode or using standard Twitter embed markup.
Embedded Tweet via Hugo Shortcode
Visualizza il post su Twitter/X
Embedded Tweet via Standard Blockquote
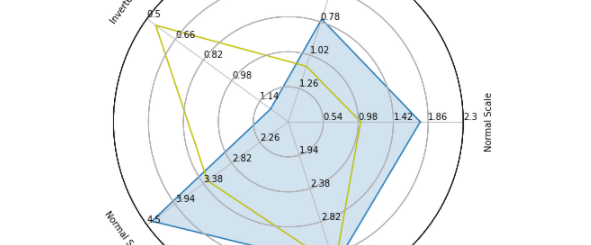
A reminder of why radar plots are misleading. Eye focuses on area, not length. pic.twitter.com/Dk3gcn1GD1
— Luke Bornn (@LukeBornn) May 17, 2017
4. Code Blocks & Syntax Highlighting
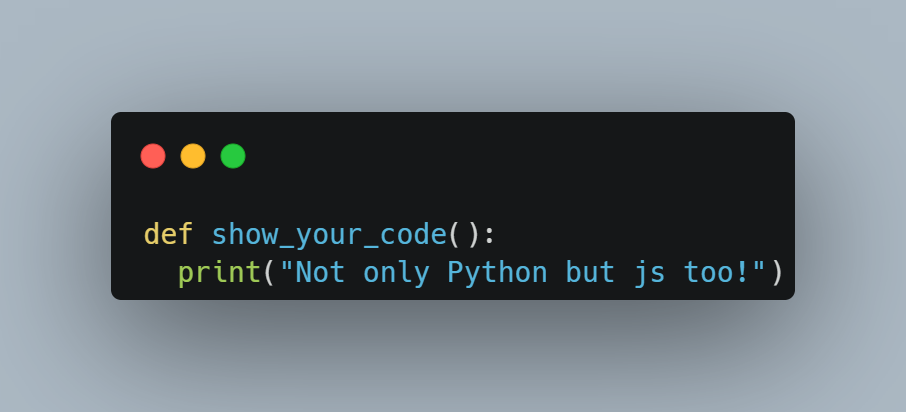
Code syntax highlighting uses the built-in Chroma highlighter styled with dark themes and line numbers.
Python
 1from dataclasses import dataclass
 2from typing import List, Optional
 3import pandas as pd
 4
 5@dataclass
 6class ExperimentResult:
 7    run_id: str
 8    loss: float
 9    accuracy: float
10    tags: List[str]
11    notes: Optional[str] = None
12
13def compute_summary(df: pd.DataFrame) -> pd.DataFrame:
14    """Calculates aggregate metrics across experiment runs."""
15    return (
16        df.groupby("category")
17        .agg(mean_loss=("loss", "mean"), max_acc=("accuracy", "max"))
18        .sort_values(by="max_acc", ascending=False)
19    )
20
21# Execution test
22print("Pipeline initialized successfully.")
Modern JavaScript
 1async function fetchMetrics(endpoint, options = {}) {
 2  try {
 3    const response = await fetch(endpoint, {
 4      headers: { "Content-Type": "application/json" },
 5      ...options
 6    });
 7    if (!response.ok) throw new Error(`HTTP Error ${response.status}`);
 8    return await response.json();
 9  } catch (err) {
10    console.error("Failed to retrieve metrics:", err.message);
11    return null;
12  }
13}
SQL & Shell
 1SELECT
 2    user_id,
 3    COUNT(order_id) AS total_orders,
 4    SUM(amount_eur) AS revenue,
 5    AVG(duration_mins) AS avg_session
 6FROM analytics.user_sessions
 7WHERE created_at >= '2026-01-01'
 8GROUP BY 1
 9HAVING total_orders > 5
10ORDER BY revenue DESC
11LIMIT 100;
1# Build the Hugo site in production mode
2hugo --minify --gc
3
4# Start local development server with draft previews
5hugo server --buildDrafts --disableFastRender
5. Collapsible Sections (<details> & <summary>)
🔍 Click to expand detailed debugging output
Inside a collapsible block, standard Markdown elements continue to function smoothly:
1{
2  "status": "success",
3  "server": "hugo-0.165.0",
4  "theme": "hugo-bearblog",
5  "features_verified": ["math", "d3", "twitter", "code", "tables", "footnotes"]
6}
Math formulas also render inside collapsible blocks: $\sum_{i=1}^n i = \frac{n(n+1)}{2}$.
6. Footnotes
Footnotes are fully supported1 with back-references to jump effortlessly back and forth2. Even multi-paragraph footnotes containing formatted text and code blocks are handled cleanly3.
7. Data Tables
| Feature Area | Technology | Status | Integration Mode |
|---|---|---|---|
| Maths | KaTeX 0.18.4 | ✅ Working | math = true (CDN) |
| Plots & Charts | D3.js v7.9.0 | ✅ Working | d3 = true (CDN) |
| Social Embeds | X / Twitter Widgets | ✅ Working | twitter = true / shortcode |
| Code Syntax | Chroma (github-dark) | ✅ Working | Hugo native markup |
| Comments | Disqus | ✅ Working | disqusShortname config |
| Taxonomies | Tags & Categories | ✅ Working | Hugo taxonomies |
8. Blockquotes & Formatting
“Simplicity is prerequisite for reliability.” — Edsger W. Dijkstra
Nested blockquotes are also properly indented and styled with muted border accents and clean typography.
Text styling checklist:
- Bold text and italicized text
Strikethrough text- Inline code like
numpy.ndarrayandd3.scaleLinear() - External links such as Official Hugo Documentation
9. Images & Visual Assets
Inline Figure with Caption